- Root: Vendor + GL Account Name + Class
- Mid-level: GL Account Name + Class
- GL-Level: GL Account Name
- Reporting Category: New rollup category
- Summary: Parent Category
- Set up your root database with your most detailed GL data
- Use a lookup to map GL Accounts to your reporting categories
- Aggregate data in a hierarchy that suits your business
- Create a Page you can use for reporting and sharing
- Drill-in from the top of your hierarchy to the most detailed data feeding your model
Note: Runway supports many GL integrations including Quickbooks, Xero, Netsuite, Campfire, Rillet and more. If you haven’t connected your General Ledger data, follow the guides for Accounting integrations here.
Step 1: Bring your GL data into a source Income Statement database
-
Create a new **database **by clicking
+next to any item in the sidebar -
Name the database
Level 1: Income Statement by Vendor -
Click
editIn the database configuration menu and choose the following inputs:-
Data Source: Choose the integration source query
IS Data -
Driver: Income Statement Amount
- Set Using
transaction datefor dates
- Set Using
-
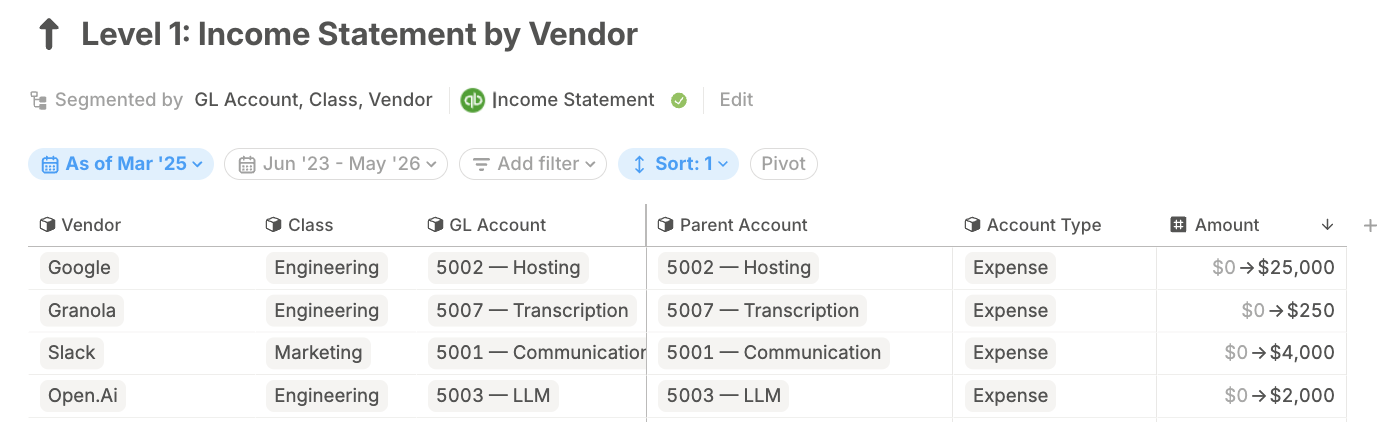
Segments (which will define each row of data)
VendorClassGL Account Name
-
Add Other columns that will serve as metadata for your segments and be used to group, filter and categorize your GL data
Parent AccountAccount Type
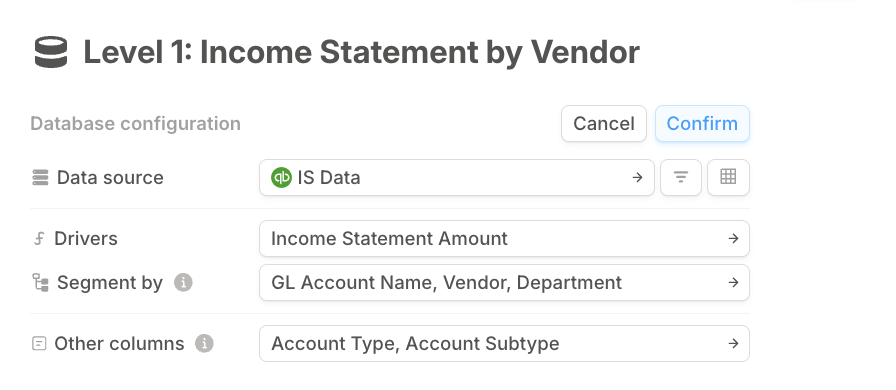
-
Data Source: Choose the integration source query
-
Click Confirm to load the database
Step 2: Use a lookup table to map GL Accounts to your reporting categories
If you typically recategorize your General Ledger Accounts into different reporting categories. Follow directions to create a Data source-powered lookup that pairsGL Account Names with a Reporting Category dimension.
Add a lookup column in the Level 1: Income Statement by Vendor database
- Select Insert Values of
Reporting Categoryfrom **Lookup Table **usingGL Account Name - You will see
Reporting Categoryitems populate the lookup column.
Step 3: Configure databases to set a P&L hierarchy
You now want to simplify your view from the raw data by removing Vendor as a segment — this reduces the granularity of this database-
**Create a new database **by clicking
+next to any item in the sidebar - Name the database Level 2: Income Statement by GL Account Name and Class
-
Click edit In the database configuration menu and choose the following inputs:
- Data Source: Set the data source to your root database e.g., Level 1: Root Income Statement database
- Driver: Amount
- Segments: Select only
GL Account NameandClass - Add Other columns for
Parent AccountorAccount Typeagain, as well as theReporting Categorylookup column
- Create a new database named Level 3: Income Statement by GL.
- Click edit in the database configuration menu and select the following:
- Data Source: Set the data source to your Level 2: Income Statement by GL and Class database
- **Driver: **Amount
- Segments: Select only
GL Account Name - Add Other columns for
Parent AccountorAccount TypeandReporting Category
- Click confirm
Level 4: Reporting Category and Level 5: Account Type
Your final database will be home to your top-level drivers by Account Type which are the aggregation of all underlying databases. Usually these are Revenue, Other Revenue, COGS, Expense and Other Expense
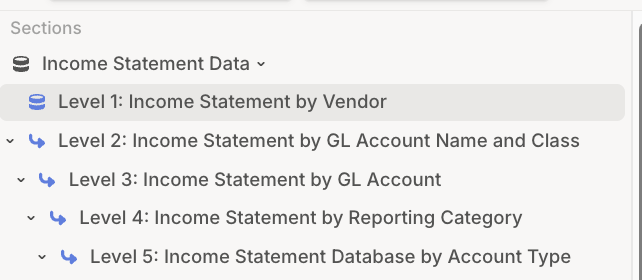
It’s helpful to organize the sidebar using Sections for Income Statement Data and nest the databases to visually remind yourself of their hierarchy
Step 4: Complete your P&L report on a page
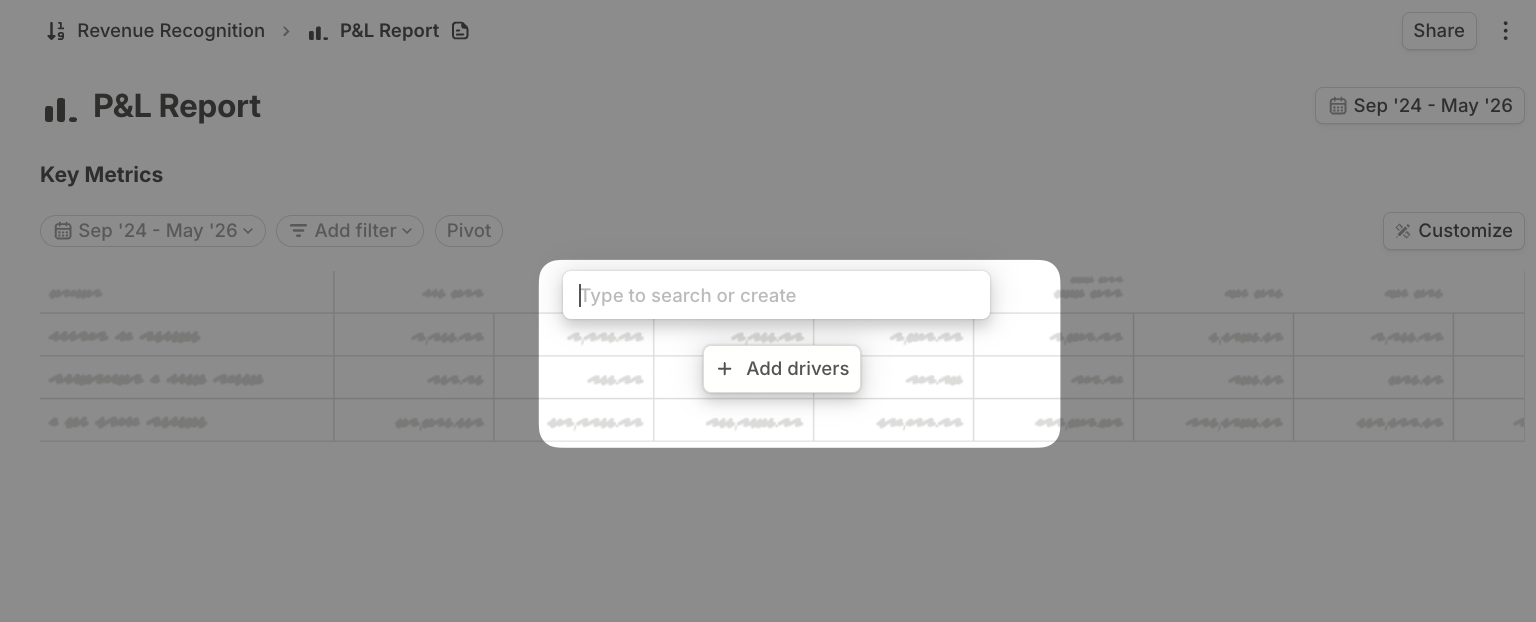
Creating the hierarchy of databases gave us the drivers you’ll need to create an output on a page and start wiring up your P&L with other drivers like Gross Margin and Total Revenue- Create a Page from the sidebar
- Add a drivers table block by clicking the forward / for options
- Start typing Income Statement Amount in the serach bar to call the drivers from the Income Statement databases you’ve set up
- You will see Income Statement Amount at all of the segmentations of your databases. Select Income Statement Amount Account Type to pull in the most aggregated drivers at the top of your income statement onto the page Now by drilling into your drivers from top-down and by adding new drivers, you will build the your P&L report output
- Pages have affordances to create new drivers and build formulas, like for Gross Profit
-
You can add drivers to the report via drill-in. If you click the carat to the left of any driver, you will see the sequential drill down through the database stack you constructed.
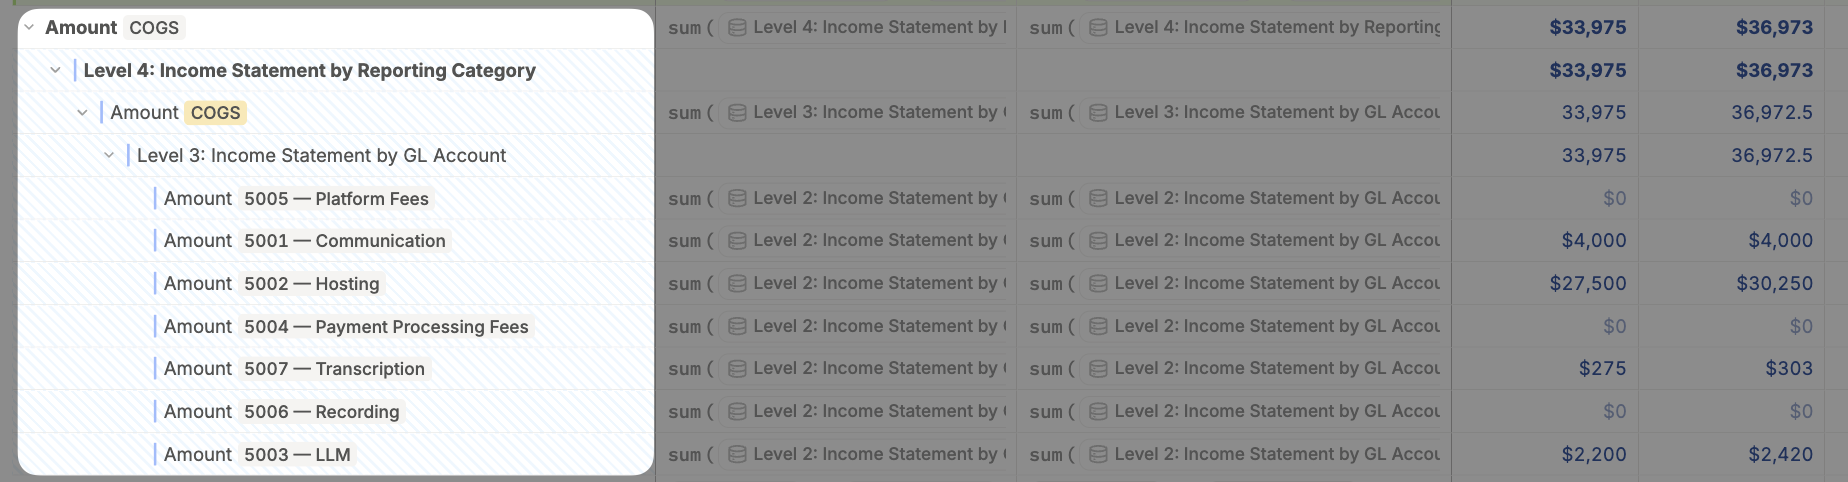
-
If you select the drivers shown in the drill-in, and right-click, you will see an option to Add to Block. This will add the drivers to your page view
- The last step is to collapse the Amount COGS driver so only the top level driver and inputs are showing on the report that you share
- The drill-in view is local to your view, you have to select Add to block to expose the drill-in drivers in a report to share
- You can apply other formatting options like Hide Driver Name and Format as Text to craft a report that mimics the P&L you present from excel.