Why segment your drivers
Easier & scalable modeling
Segmenting your drivers help you build scalable models that are easier to maintain and expand.
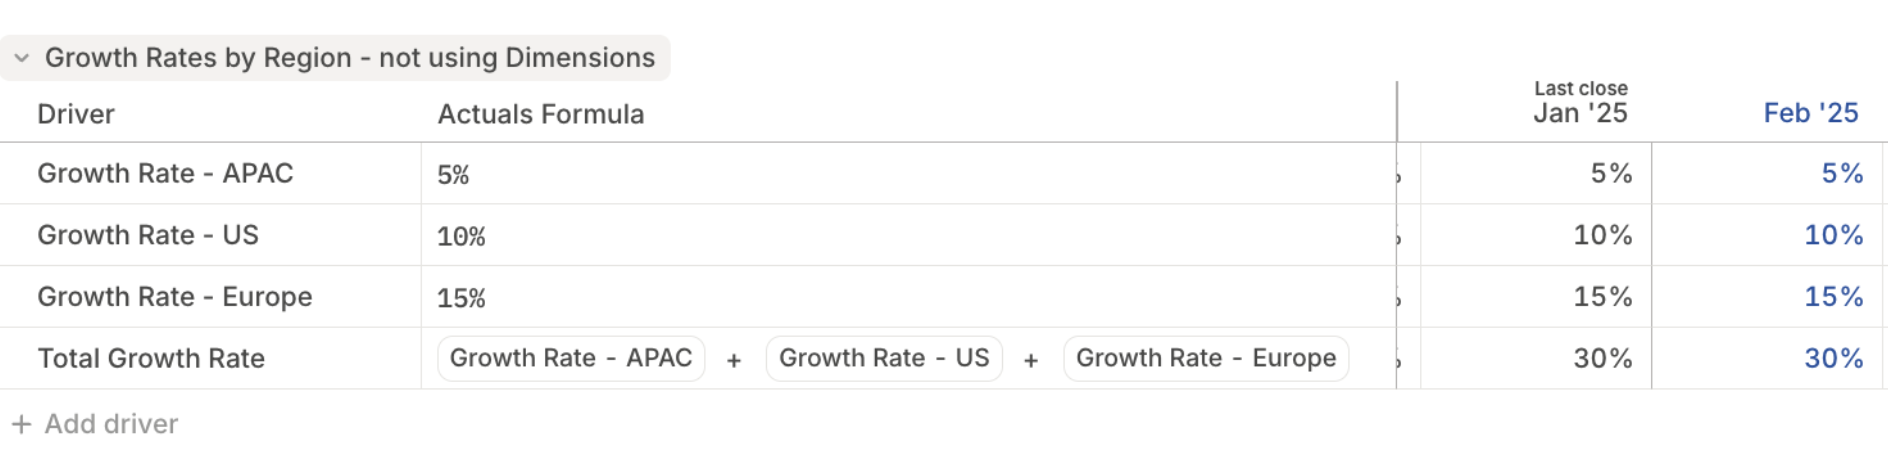
Take this example: you want to model Growth Rate by Region. You could create separate drivers like Growth Rate - US, Growth Rate - EMEA, etc.—but that naming convention gets messy fast.
When you segment drivers without using dimensions, you have to create formulas for your totals that reference each driver individually.
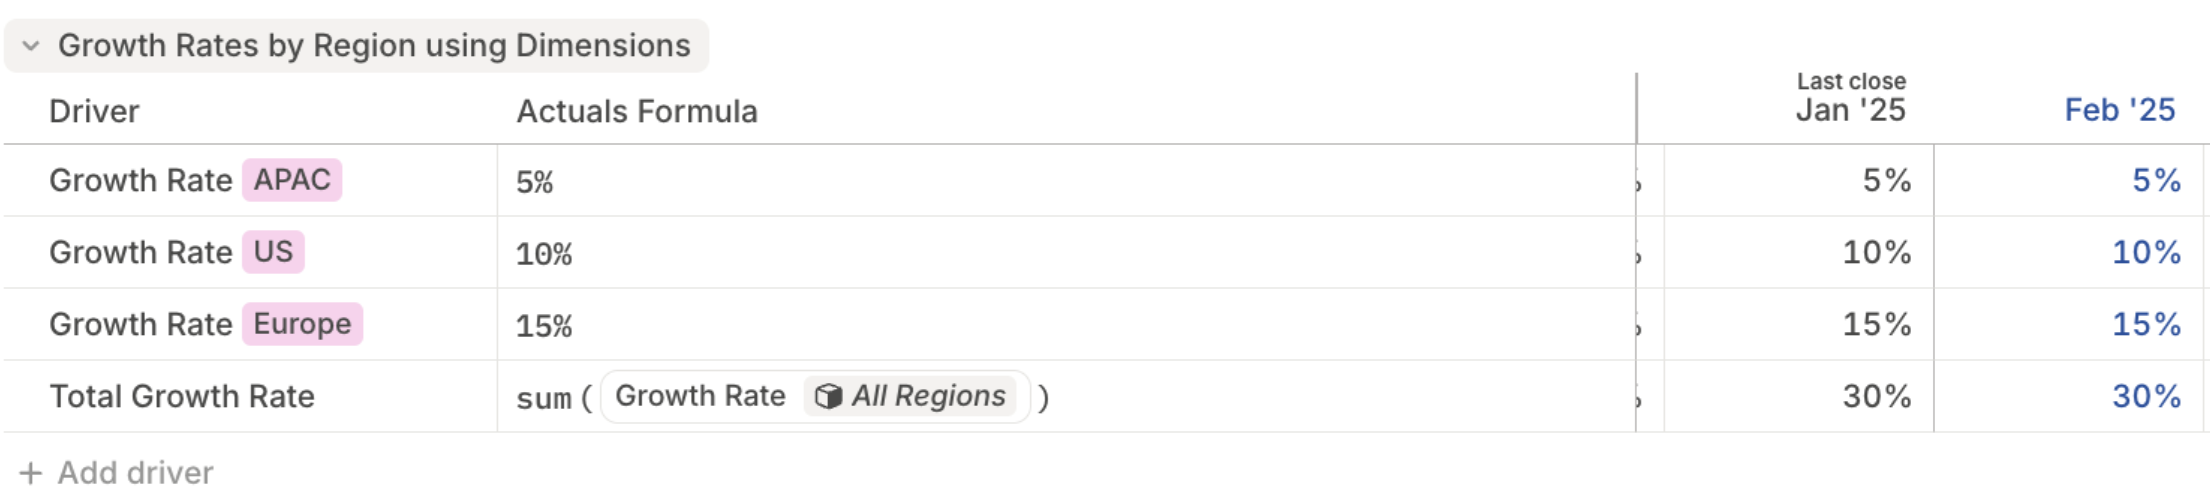
 Instead, by segmenting a single Growth Rate driver using a Region dimension, you unlock powerful benefits.
- You can write one formula that is inherited by all regions using This Segment.
- When you segment drivers in a database, which is the recommended path, aggregations like
sum(Growth Rate [All Regions]) stay maintained as new items get added to a dimension.
- Segmenting a driver by a dimension makes it easy to slice drivers further and see more detailed cuts of data - just add another dimension as a segment.
 Without dimensions, you’d need to manually create and maintain each driver, and manually update your formulas any time your data changes. With dimensions, Runway does the heavy lifting for you.
Rollup and drill into your data
Dimensions make it easy to model your data at different levels of granularity—and to roll things up and drill-in when needed.
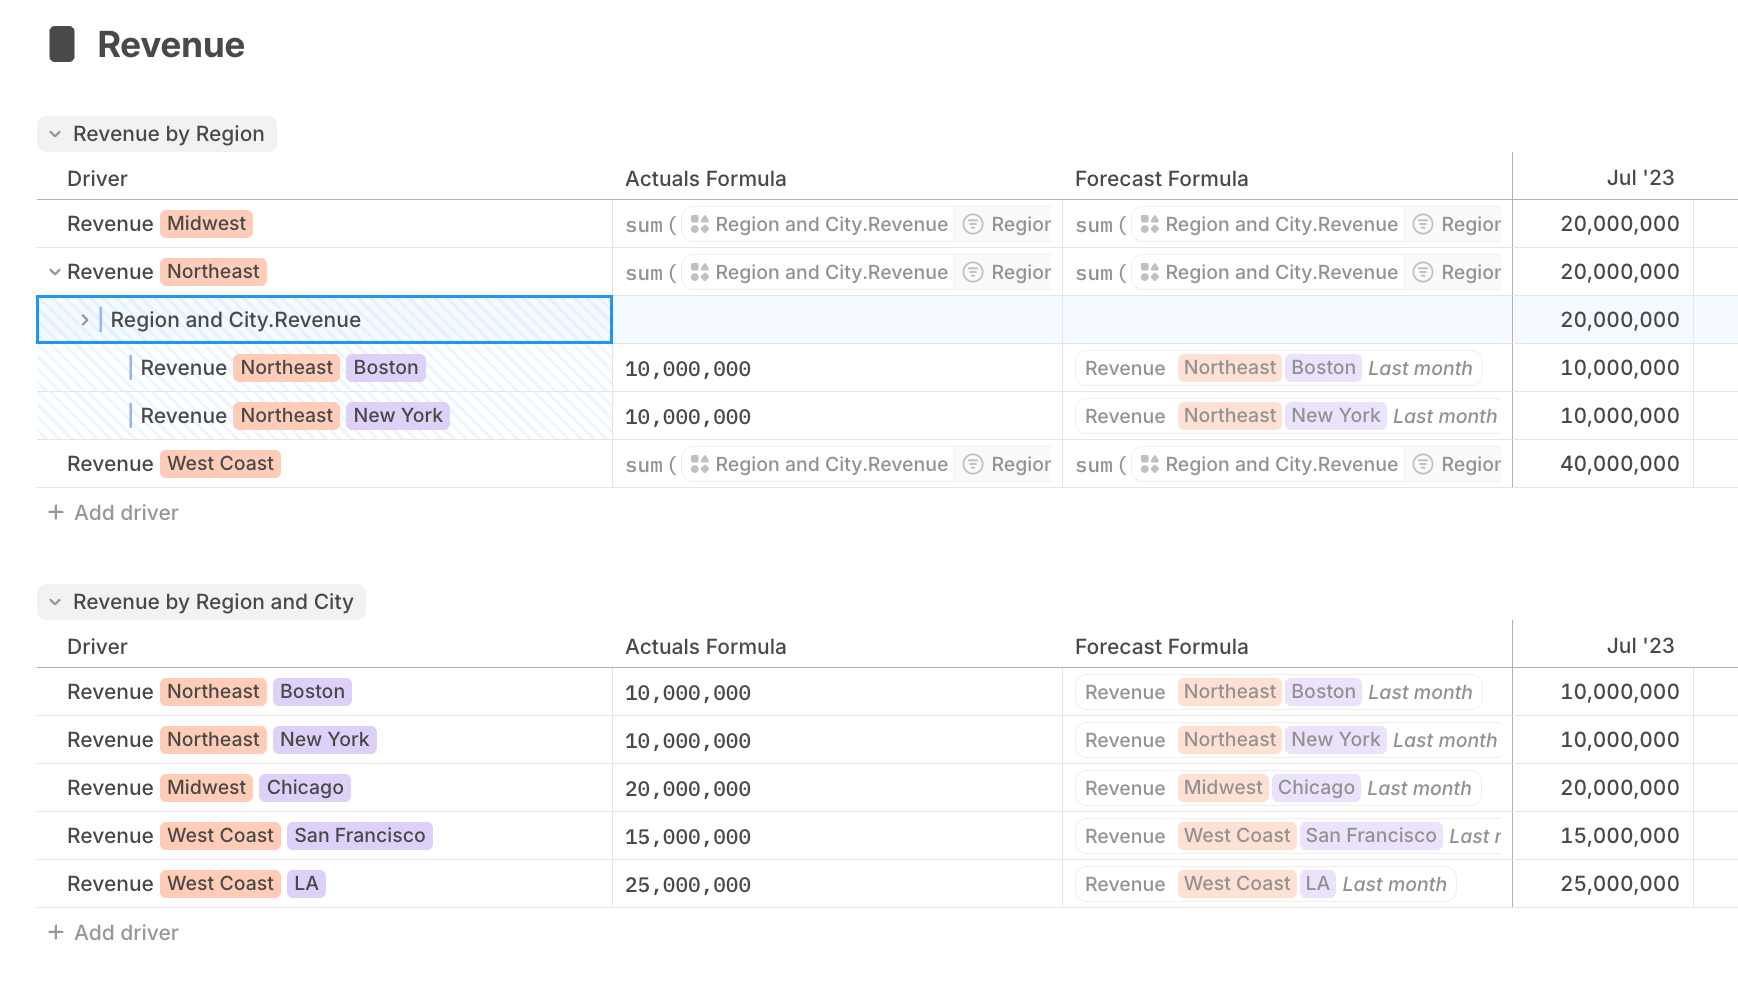
Let’s say you have a database with Revenue segmented by both Region and City. This means you have one driver for every segment (combinations of region and city).
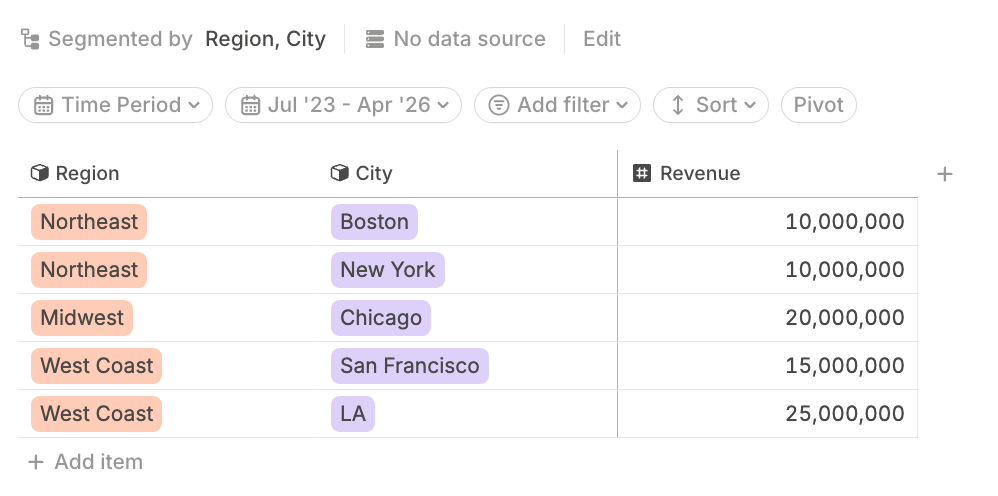 If you want to also view Revenue rolled up just by Region, you can easily do this by creating a rolled-up database:
- Open the target database where you want the rolled-up data to live or create a new one.
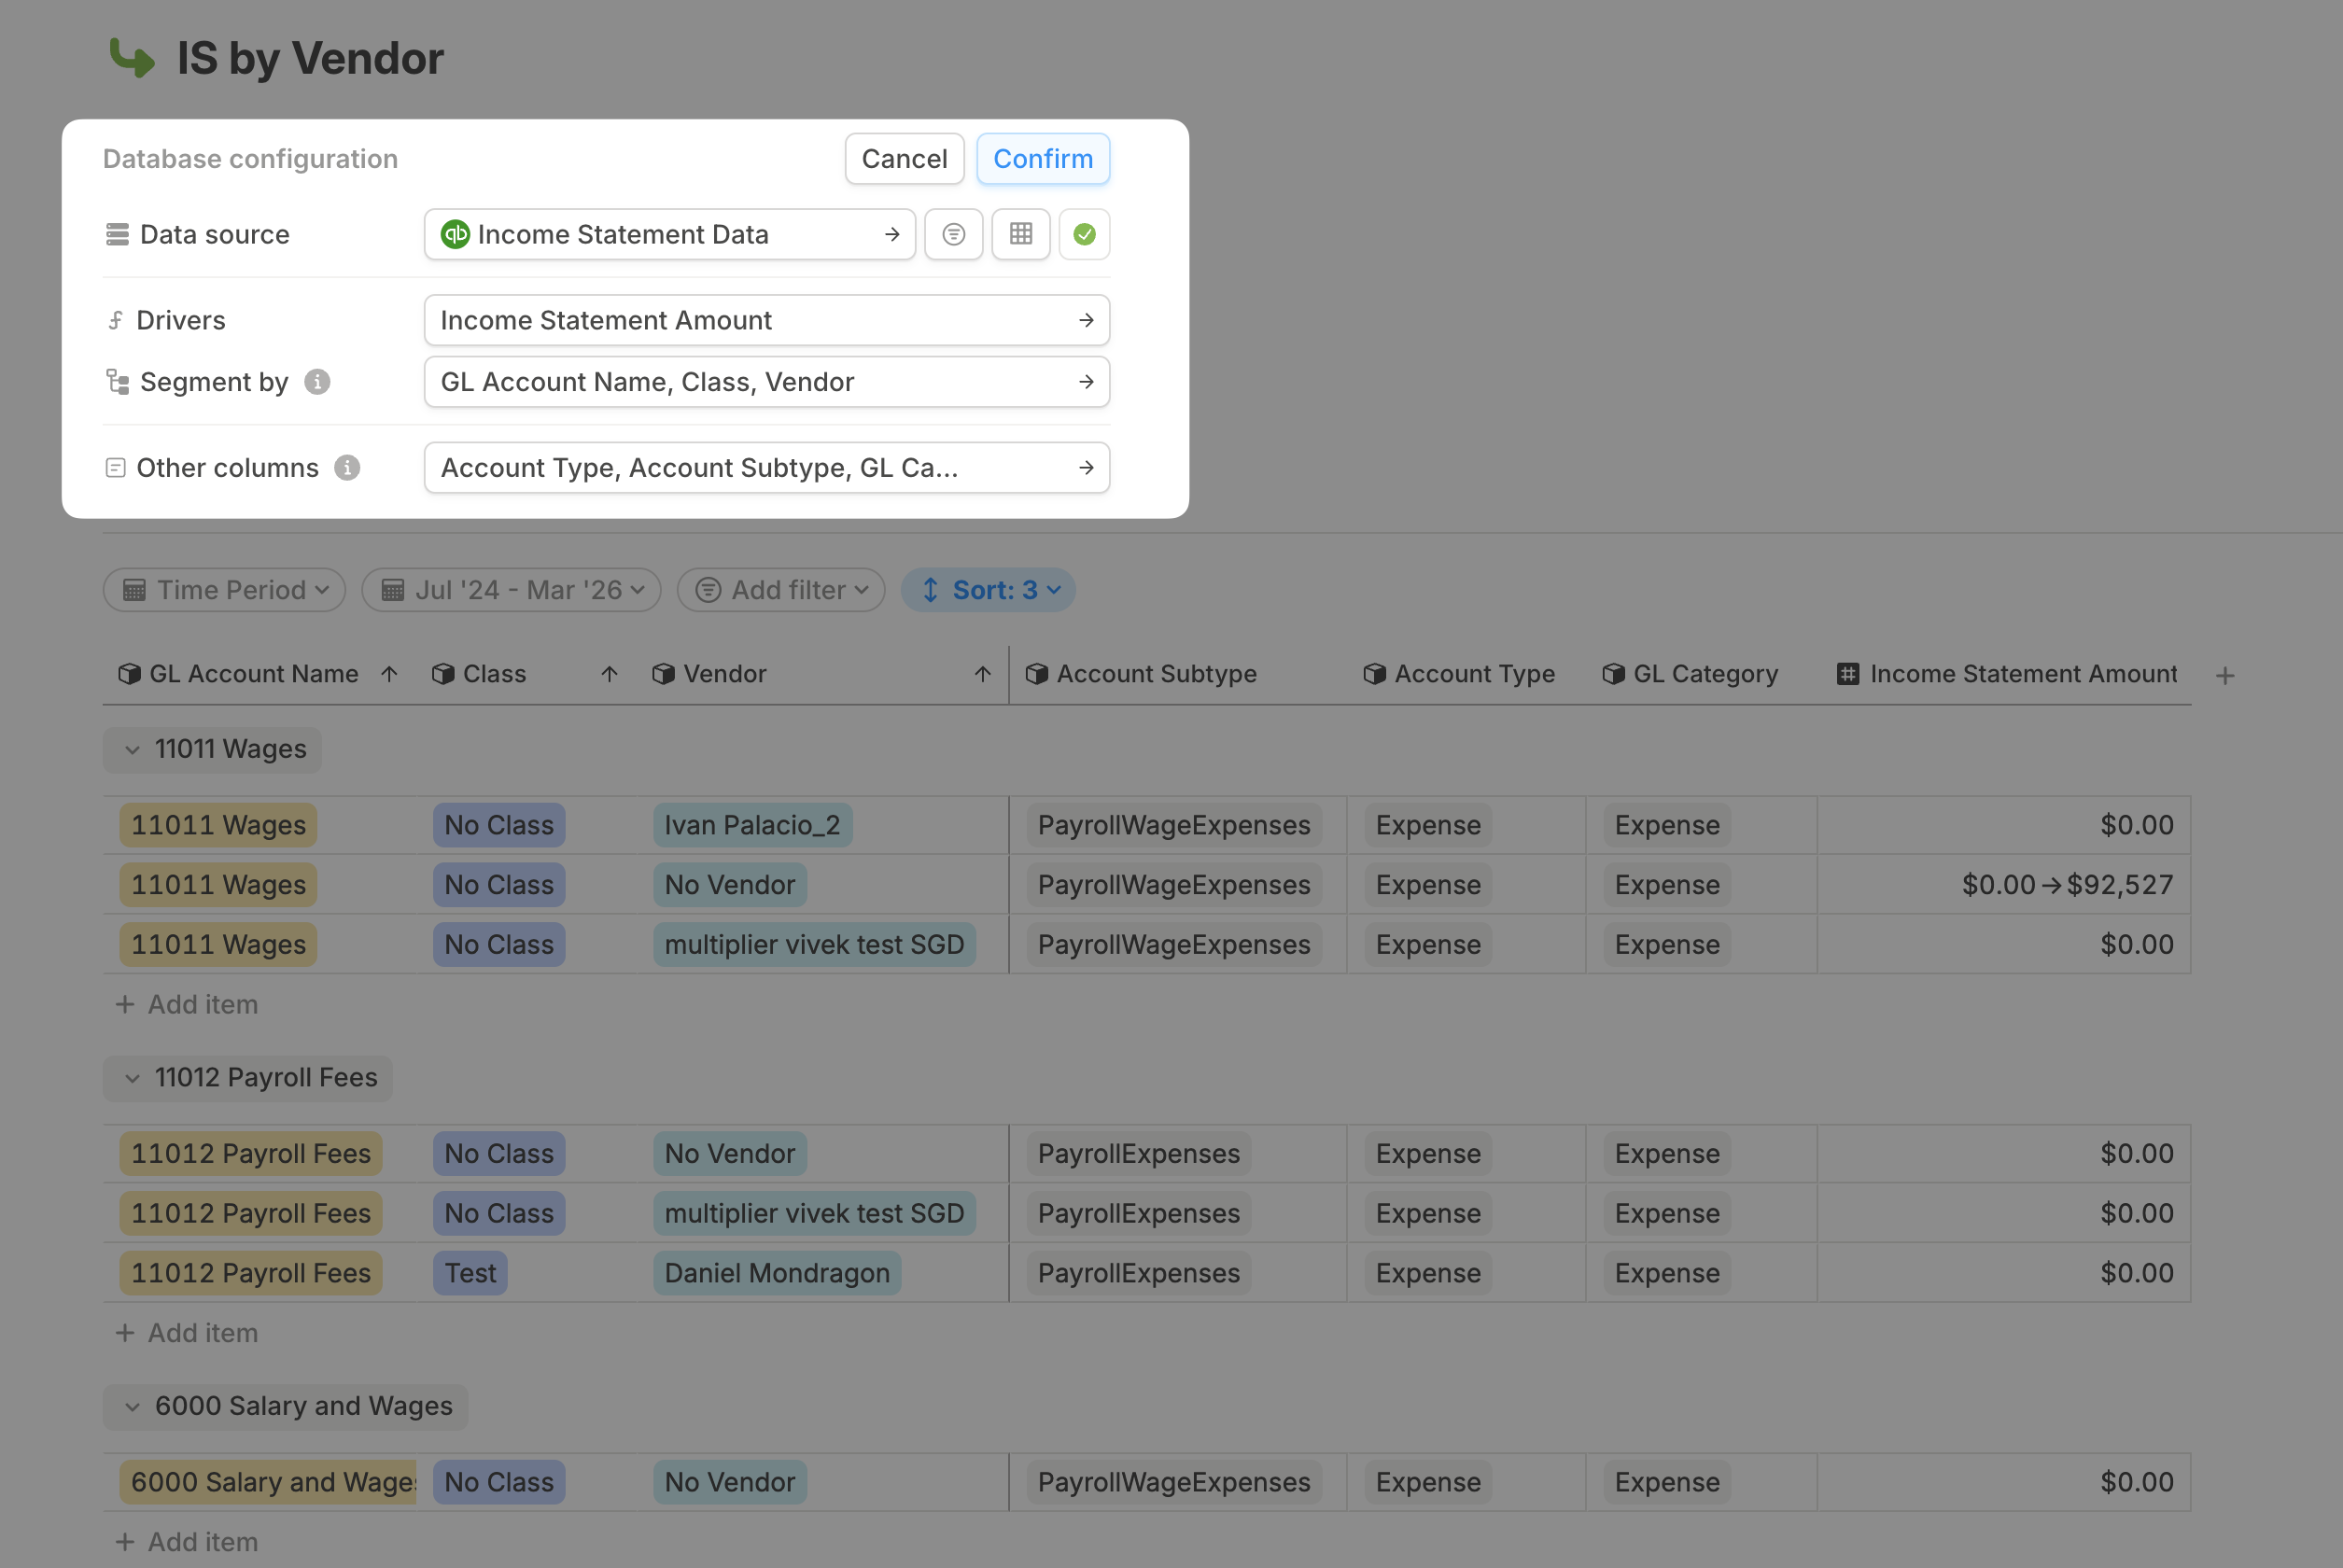
- Click Edit to open the database configuration menu.
- Add the source database (in this case, the one segmented by Region and City).
- Choose the driver(s) you want to aggregate (e.g. Revenue).
- Under Segment by, select a dimension one level higher (e.g. just Region).
- Click Confirm.
 Now, when you reference this revenue driver in a driver table block , model, or in a formula, you’ll see it available at both segmentation: Region x City, and just Region.
 This makes it easy to drill in when you want detail, and roll up when you want the big picture—without manually summing or duplicating logic.
 This allows you to group and roll up by any meaningful metadata in your database.
You can also create similar hierarchies based on other columns, not just the ones in the segmentation of the database configuration.
This allows you to group and roll up by any meaningful metadata in your database.
You can also create similar hierarchies based on other columns, not just the ones in the segmentation of the database configuration.
How to segment drivers
Segmenting drivers in a database
When configuring a database, the Segment by field determines how the drivers in that database are broken down.
 For example:
- In a granular database pulling from your GL integration, you might segment by
Account Name, Class, and Vendor.
- Later, you may want to create a new database that sources data from this granular one—but rolled up—so it’s only segmented by
Class.
Segmenting drivers in a model
You can also segment a unsegmented driver in a model:
-
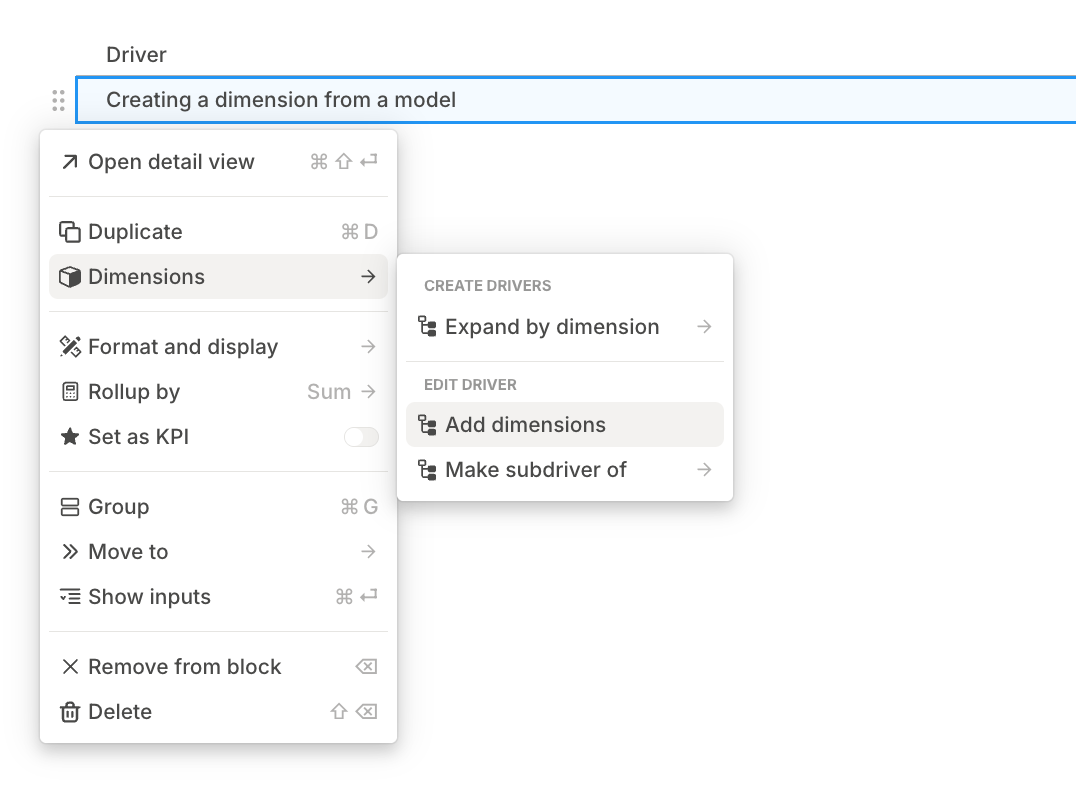
Click the 6-dot menu next to the driver name in your model.
-
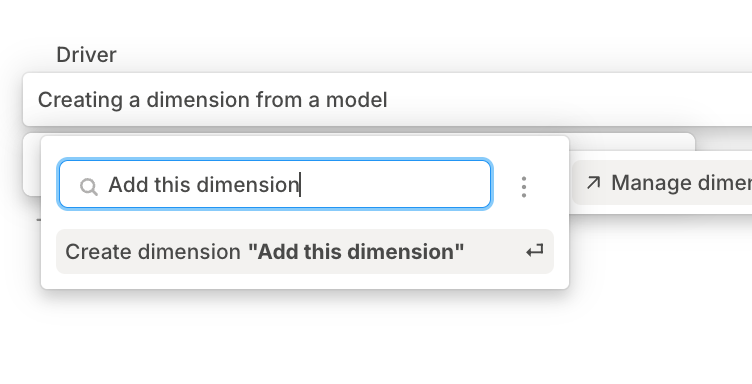
Hover over Dimensions, then select Add dimension.
-
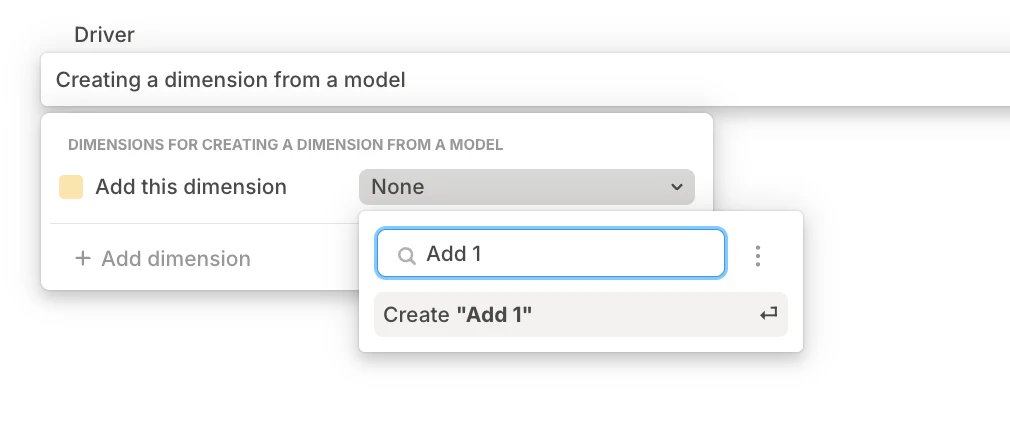
You can choose an existing dimension from the list, or type a new name and hit Enter to create a new one.
-
After creating a new dimension, you’ll be prompted to define its values (e.g., “Basic,” “Premium,” etc.) directly from the submenu.
Segmenting drivers in a model using Expand by dimension
You can use Expand by dimension to segment a driver by a dimension from a model. This is most commonly used when modeling headcount.
When you use Expand by dimension to segment drivers directly in a Model, you will have to click the 6-dot menu on a driver and selectExpand by dimension when new items get added to the dimension. Your drivers will not automatically be crated in a model for new items in a dimension.
-
When working in a model, select a driver and navigate to the 6-dot menu to the left of the driver name.
-
Hover over Dimensions, then select Expand by dimension.
-
Once you click the dimension you want to use as a segment, you will create one driver segmented by each value within that dimension.
-
Expand by dimension is more powerful if you set a formula for the driver before clicking Expand by dimension.
- Choose the filter of the dimension you want to have as your segment on a data.
- For example, formula below sums Salary from the Hiring Plan where Team is Customer Success.
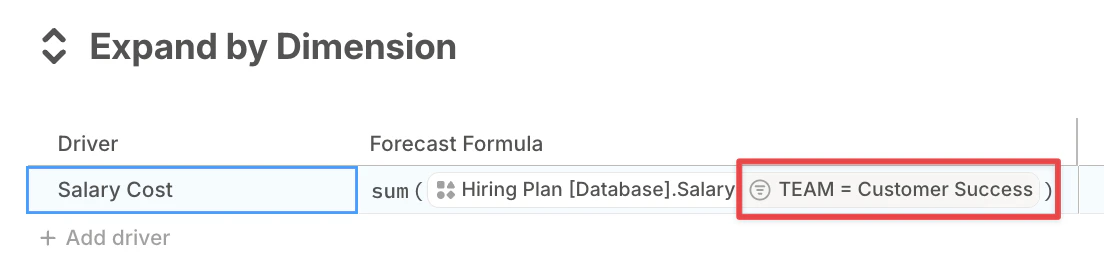
-
When you click Expand by dimension where you have used the dimension as a filter in the formula, you will see the formula smart-match to each value in the dimension.